Comparing Health Events in Populations: A Framework for Analysis
Eric Delmelle
September 2 and September 5 2025
September 2 and September 5 2025
Introduction
- Definition of Health Events: Disease outbreaks, chronic conditions, injuries, and health behaviors.
- Importance of Comparisons: Understanding disparities, identifying risk factors, guiding public health interventions.
- Key Concepts: Population health, epidemiology, and biostatistics.
Objectives of Population Health
Four Key Objectives:
- Describe: Understand population-level health outcomes.
- Explain: Identify determinants and drivers of health outcomes.
- Predict: Anticipate future health trends and patterns.
- Control: Implement interventions to improve outcomes.
Historical Context
Key Figures:
- John Snow: Cholera outbreak mapping.
- Ignaz Semmelweis: Importance of handwashing.
- Joseph Goldberger: Nutritional causes of pellagra.
Type of Comparisons
Time-Based
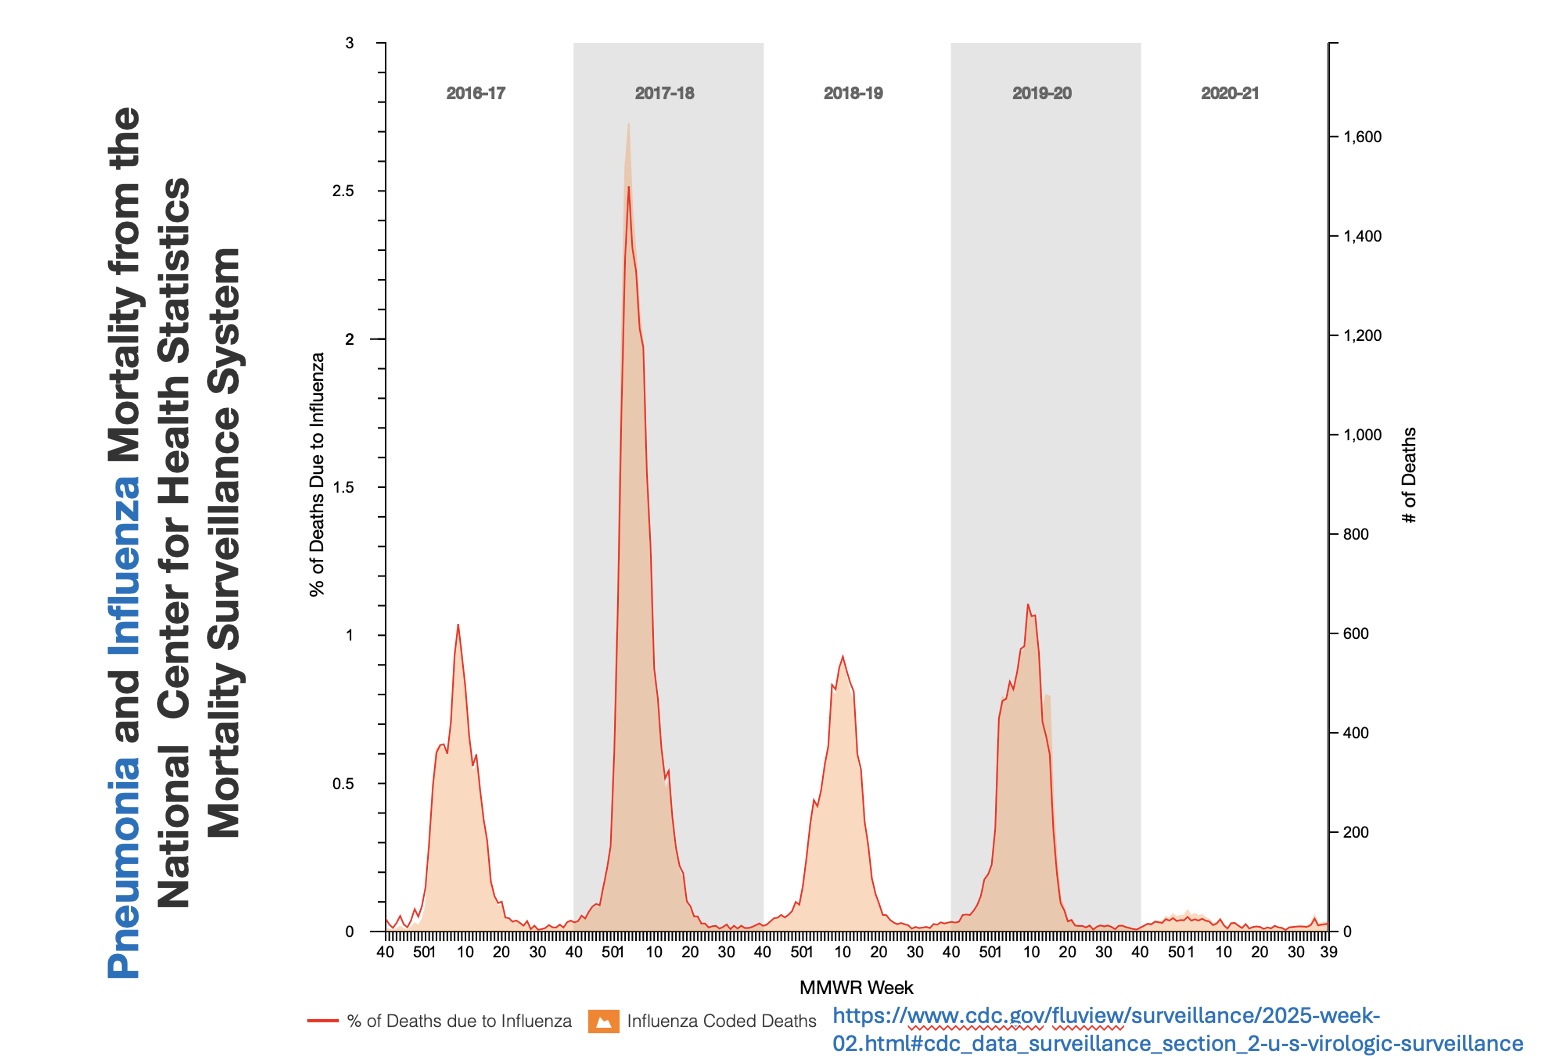
Key Metrics:
- Incidence: New cases over time.
- Prevalence: Existing cases at a given time.
Place-Based
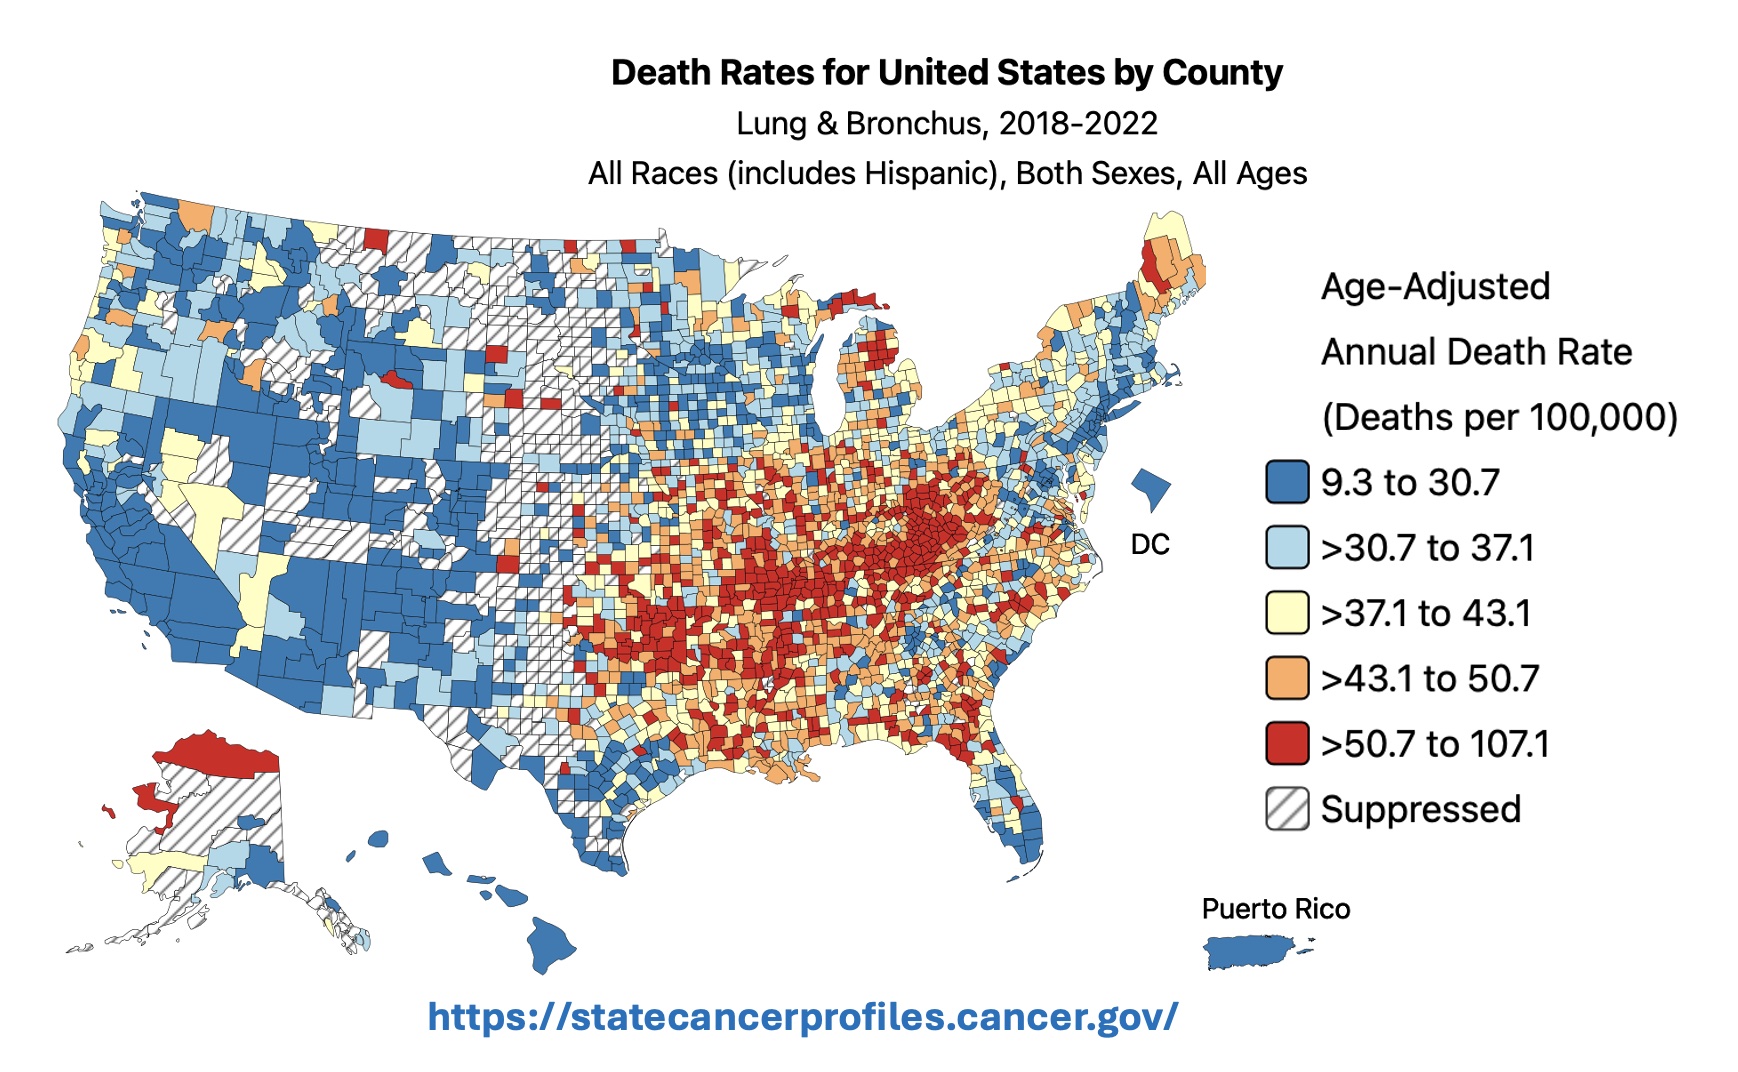
Example:
- Urban vs. Rural Heart Disease Mortality:
- Urban: 50 per 100,000.
- Rural: 75 per 100,000.
- Urban: 50 per 100,000.
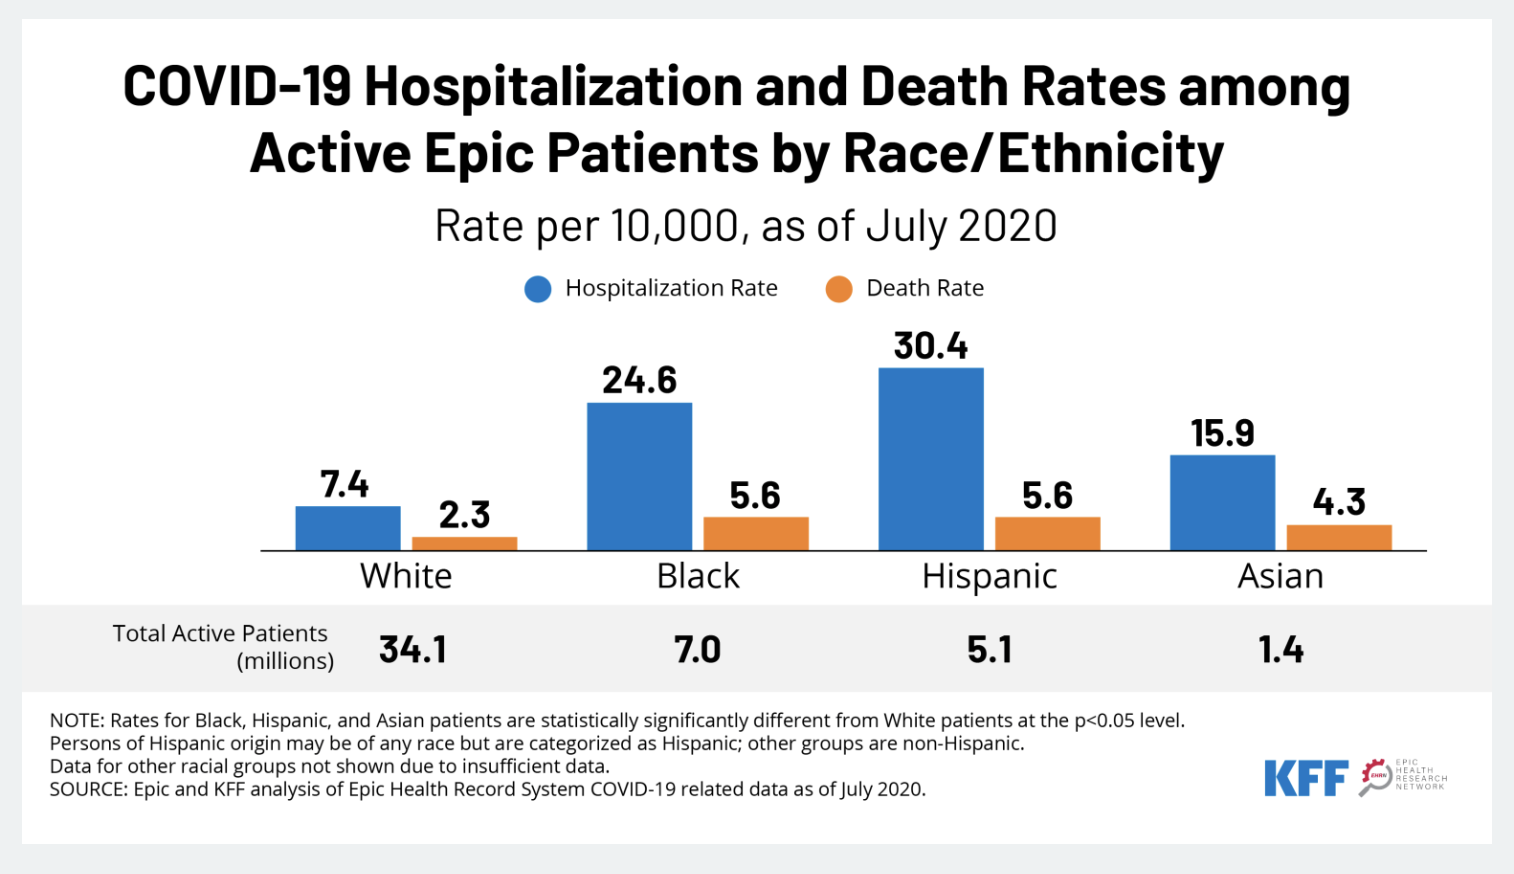
Group-Based
Example:
- Health disparities by race, age, and income.
![]()
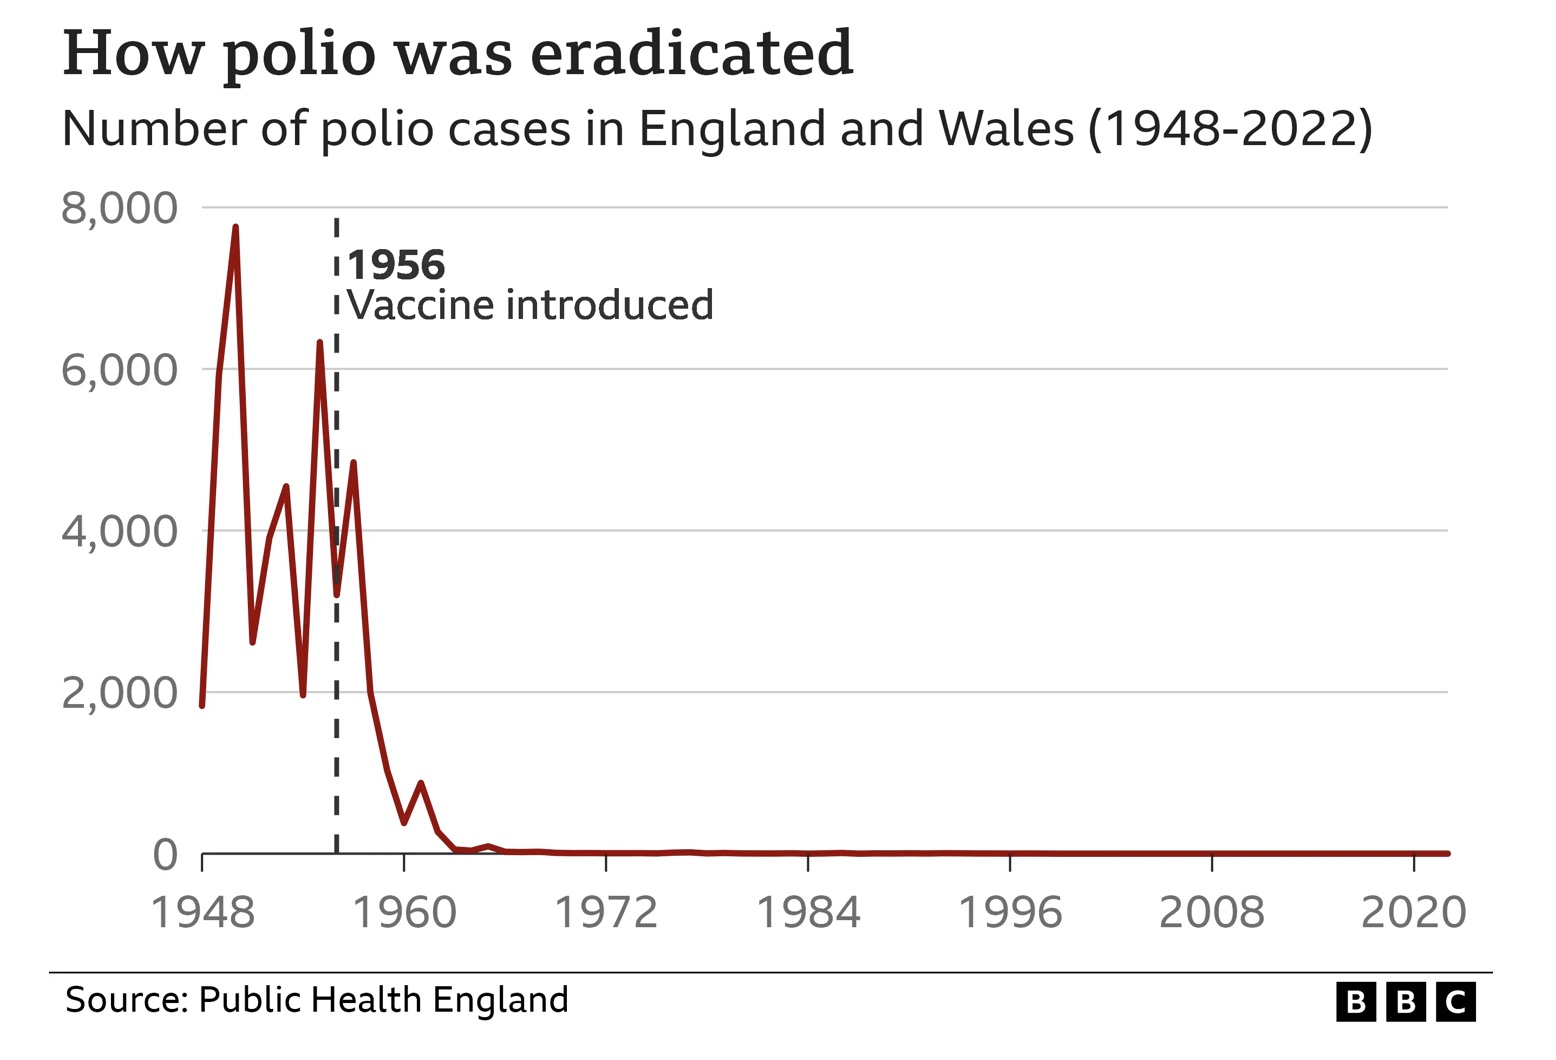
Event-Based
Key Concept:
- Natural experiments: Before vs. after policy changes or interventions.
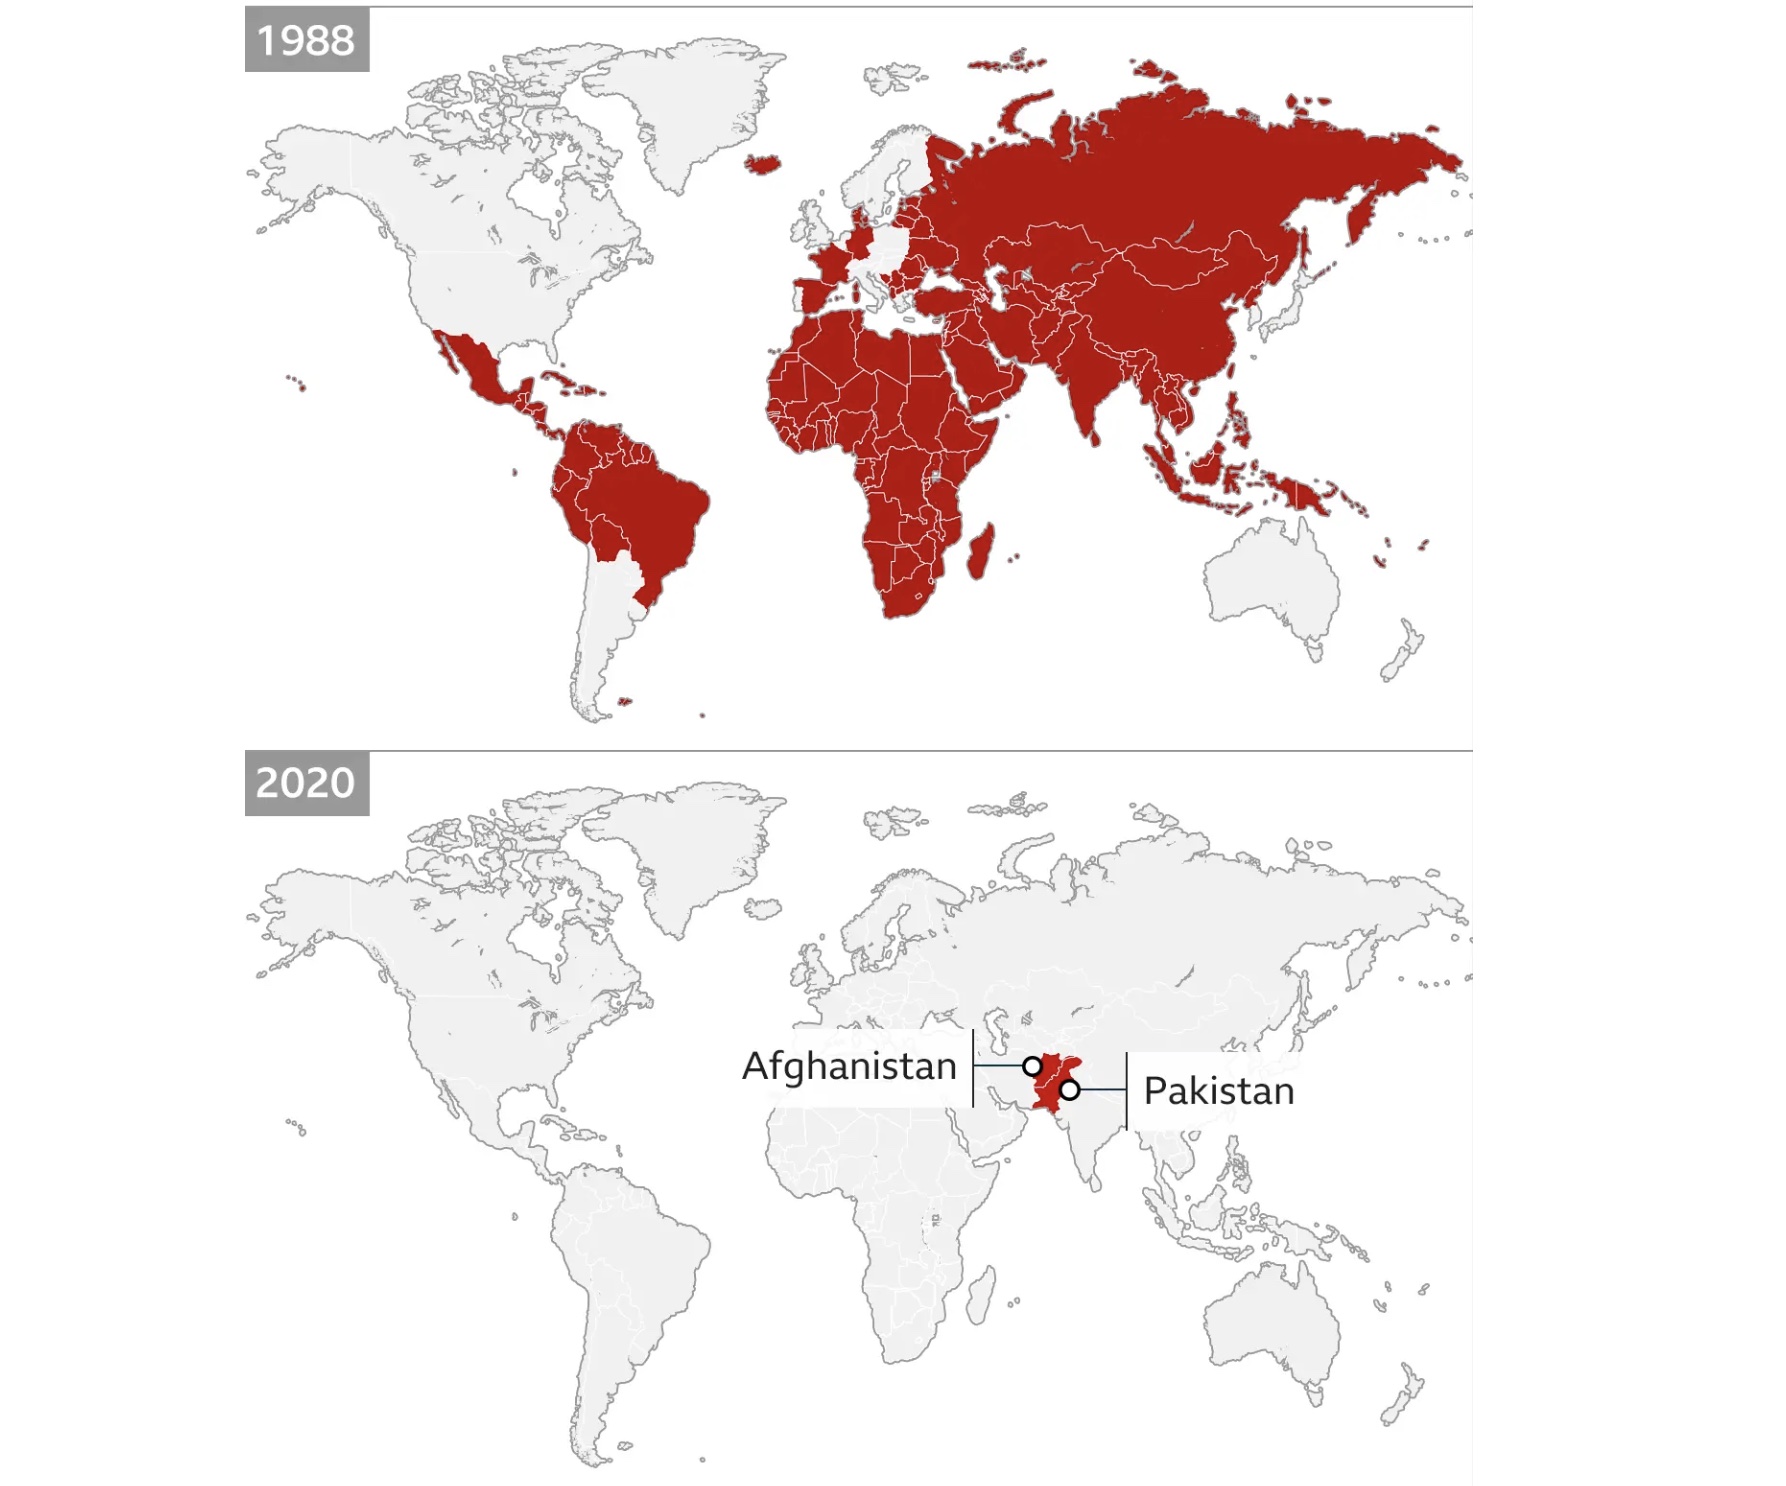
Additional Event-Based Example
Measures of Comparison
Key Metrics:
- Age-Standardized Rates: Adjusted to eliminate age structure differences.
- Attributable Risk: Measures the impact of specific risk factors on outcomes.
Levels of Analysis
Frameworks:
- Individual-Level: Biostatistical and clinical trials.
- Population-Level: Geographic and demographic patterns.
Determinants of Health
Categories:
- Social and Economic Factors
- Environmental Conditions
- Behavioral and Genetic Influences
Challenges in Comparisons
Key Challenges:
- Data Quality: Inaccuracies or incomplete datasets.
- Ethical Considerations: Privacy and fair comparisons.
Population vs. Community Health Assessments
Key Differences:
- Community Health Assessments:
- Focus on local needs/resources.
- Qualitative methods (e.g., interviews).
- Population Health Assessments:
- Broad, systemic focus.
- Quantitative data (e.g., chronic disease rates).
- Broad, systemic focus.
Population vs. Community Health Assessments
Example:
- Community: Identifying food deserts.
- Population: Obesity prevalence across counties.
Policy Implications
Using Comparisons to Drive Change:
- Set Priorities: Identify at-risk groups (e.g., elderly, low-income communities).
- Develop Interventions: Targeted programs (e.g., tobacco cessation).
- Advocate for Policy Change: Use data for systemic reforms.
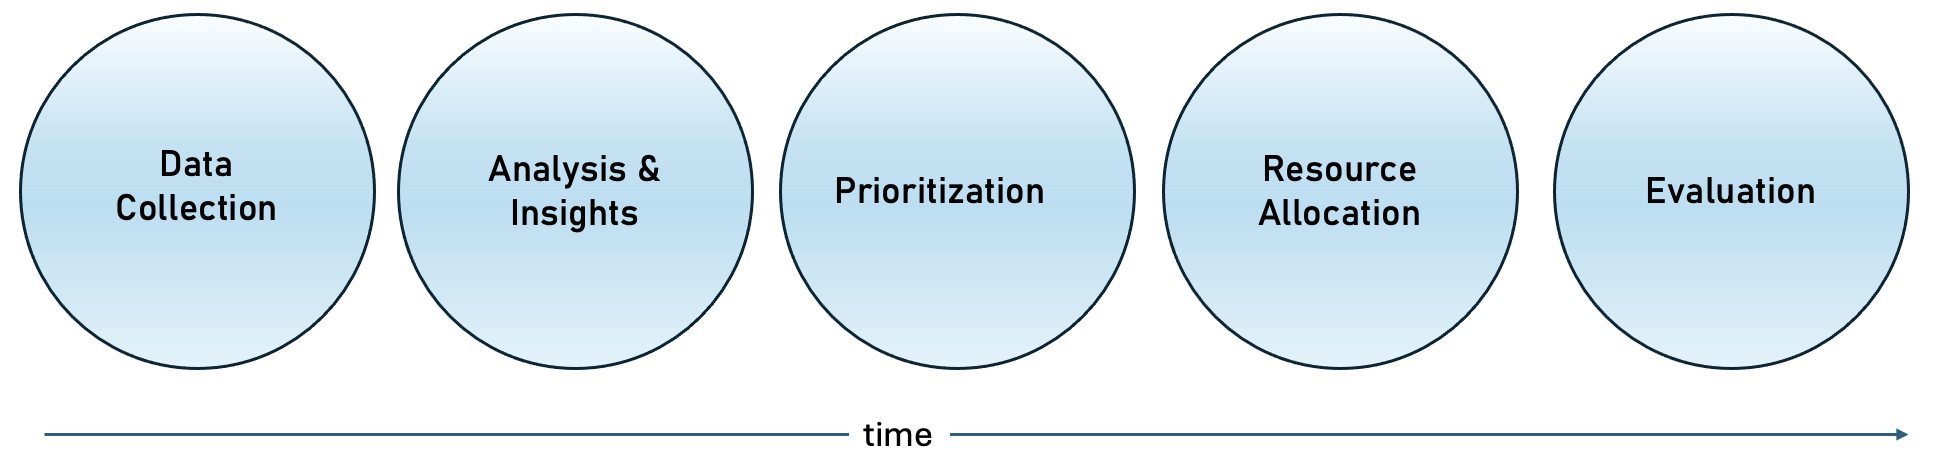
Policy Implications
Visual:
Interactive Example
Dataset Example:
| Population | Cases | Rate (per 100,000) |
|---|---|---|
| Urban | 200 | 50 |
| Rural | 300 | 75 |
Prompt:
- “What does this suggest about resource allocation?”
Recap and Transition
Key Takeaways:
- Importance of describing, explaining, predicting, and controlling health events.
- Tools and methods to compare health outcomes.
- Practical implications for population health strategies.
Next:
- Group activity: Apply concepts to a real-world health disparity.
Group Activity: Population Health Comparison
Objective:
Apply Chapter 1 metrics to analyze health disparities.
Instructions:
- Form groups of 5 (see groupe in 2 slides).
Instructions:
- Analyze the provided dataset on coursesite
- Calculate rates (e.g., incidence, prevalence).
- Identify disparities (e.g., geographic, demographic).
- Propose targeted interventions.
- Calculate rates (e.g., incidence, prevalence).
- Prepare to present findings in 3 minutes.
Group Assignments and Analysis Instructions
- Group John Snow (5): Dhyana Abeysinghe; Nora Albright; Jaimie Alva; Carrie Rothman; Mikaela Villajoaquin
- Group Pasteur (5): Cameron Driscoll; Kendall-Marie Fitzgerald; Mia Freeman; Alex Sawh; Juliea Zhao
- Group Nightingale (5): Maria Garcia Rodriguez; Sarah Haque; Daniel Hughes; Emily Snyder; Keira Conway
- Group Gupta (5): Anna Jones; Nora Kerrigan; Phillip Kim; Alana Thomforde; Herve Sanon
- Group Fauci (6): Mariana King; Esther Lee; Nicole Mejias; Aili Tutschek; Christos Vlanti; Maya Bjorneby
- Group Wakefield (5):Samantha Pfeffer; Harnek Purewal; Mary Reed; Bibian Verdugo; Mackenzie Barlow
Analysis Instructions
- Analyze the provided dataset on coursesite:
- Calculate rates (e.g., incidence, prevalence).
- Identify disparities (e.g., geographic, demographic).
- Propose targeted interventions.
- Calculate rates (e.g., incidence, prevalence).
- Presentation Guidelines:
- Prepare findings for a 3-minute presentation.
- Include key calculations, identified disparities, and proposed interventions.
- Prepare findings for a 3-minute presentation.